Client Report & Statement
Use this page to view a detailed financial summary and transaction history for a specific client. The Client Report displays invoices sent, payments received, checks issued, and revenue trends in one comprehensive dashboard.
When to use Client Report
- Reviewing a client's total transaction history and financial status
- Analyzing monthly revenue trends and payment patterns
- Verifying invoice amounts, discounts, and payment status
- Printing or exporting the client statement for accounting or customer records
- Monitoring which products the client has purchased
How to access Client Report
- Go to Business → Clients from the sidebar.
- Click on any client name or row to open the Client Detail page.
- In the top-right corner, click the View Client Report button.
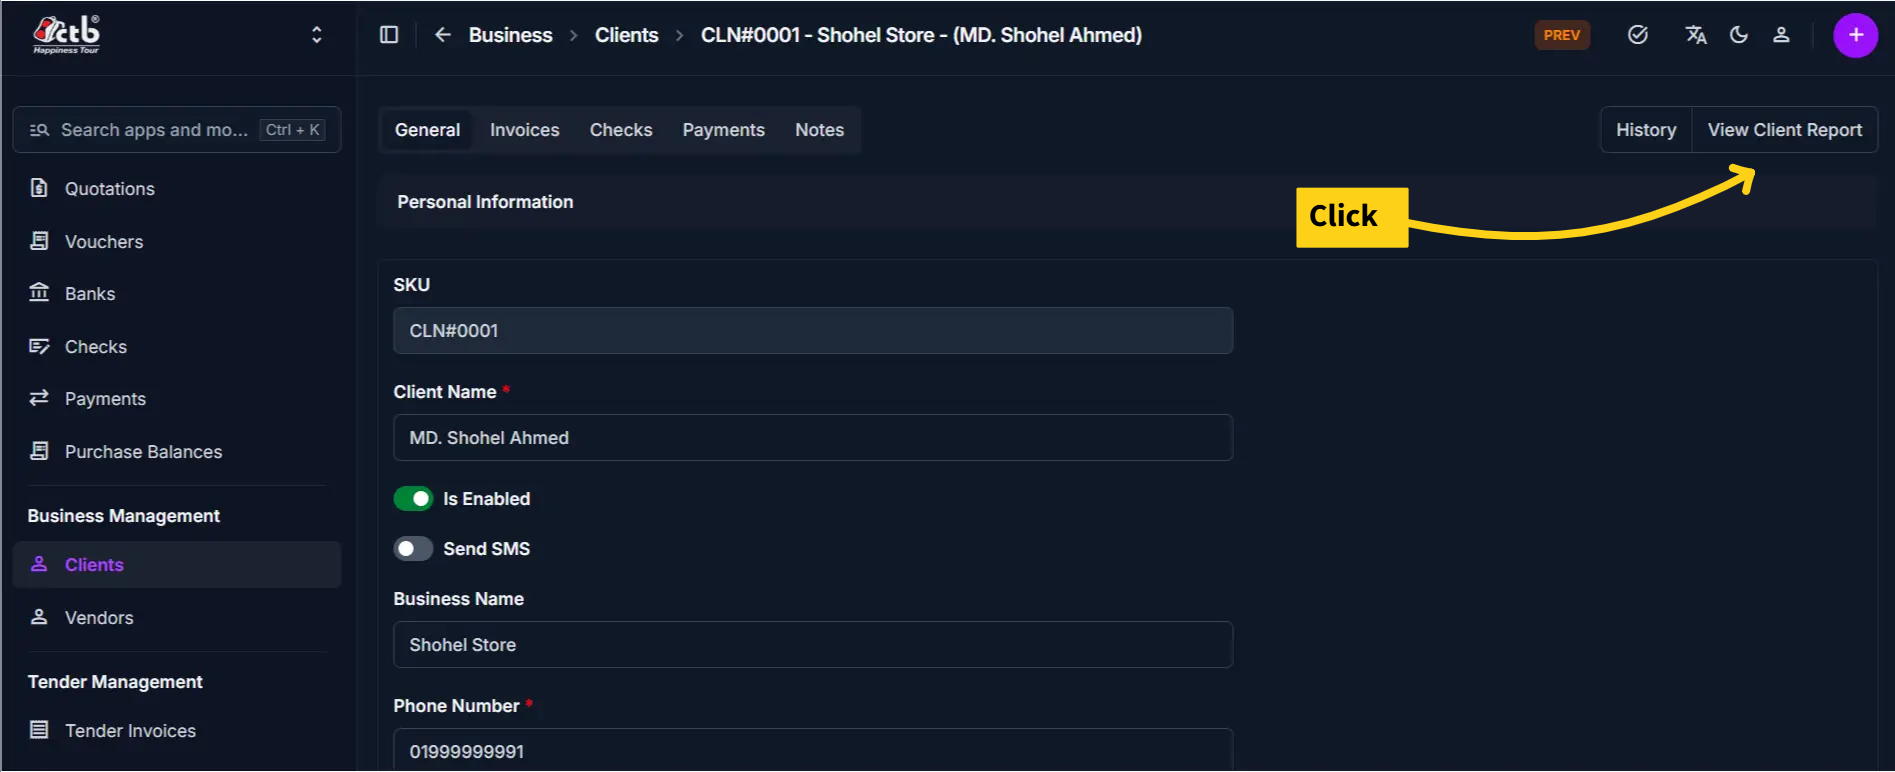
The system opens the Client Report & Statement page.
Page Overview
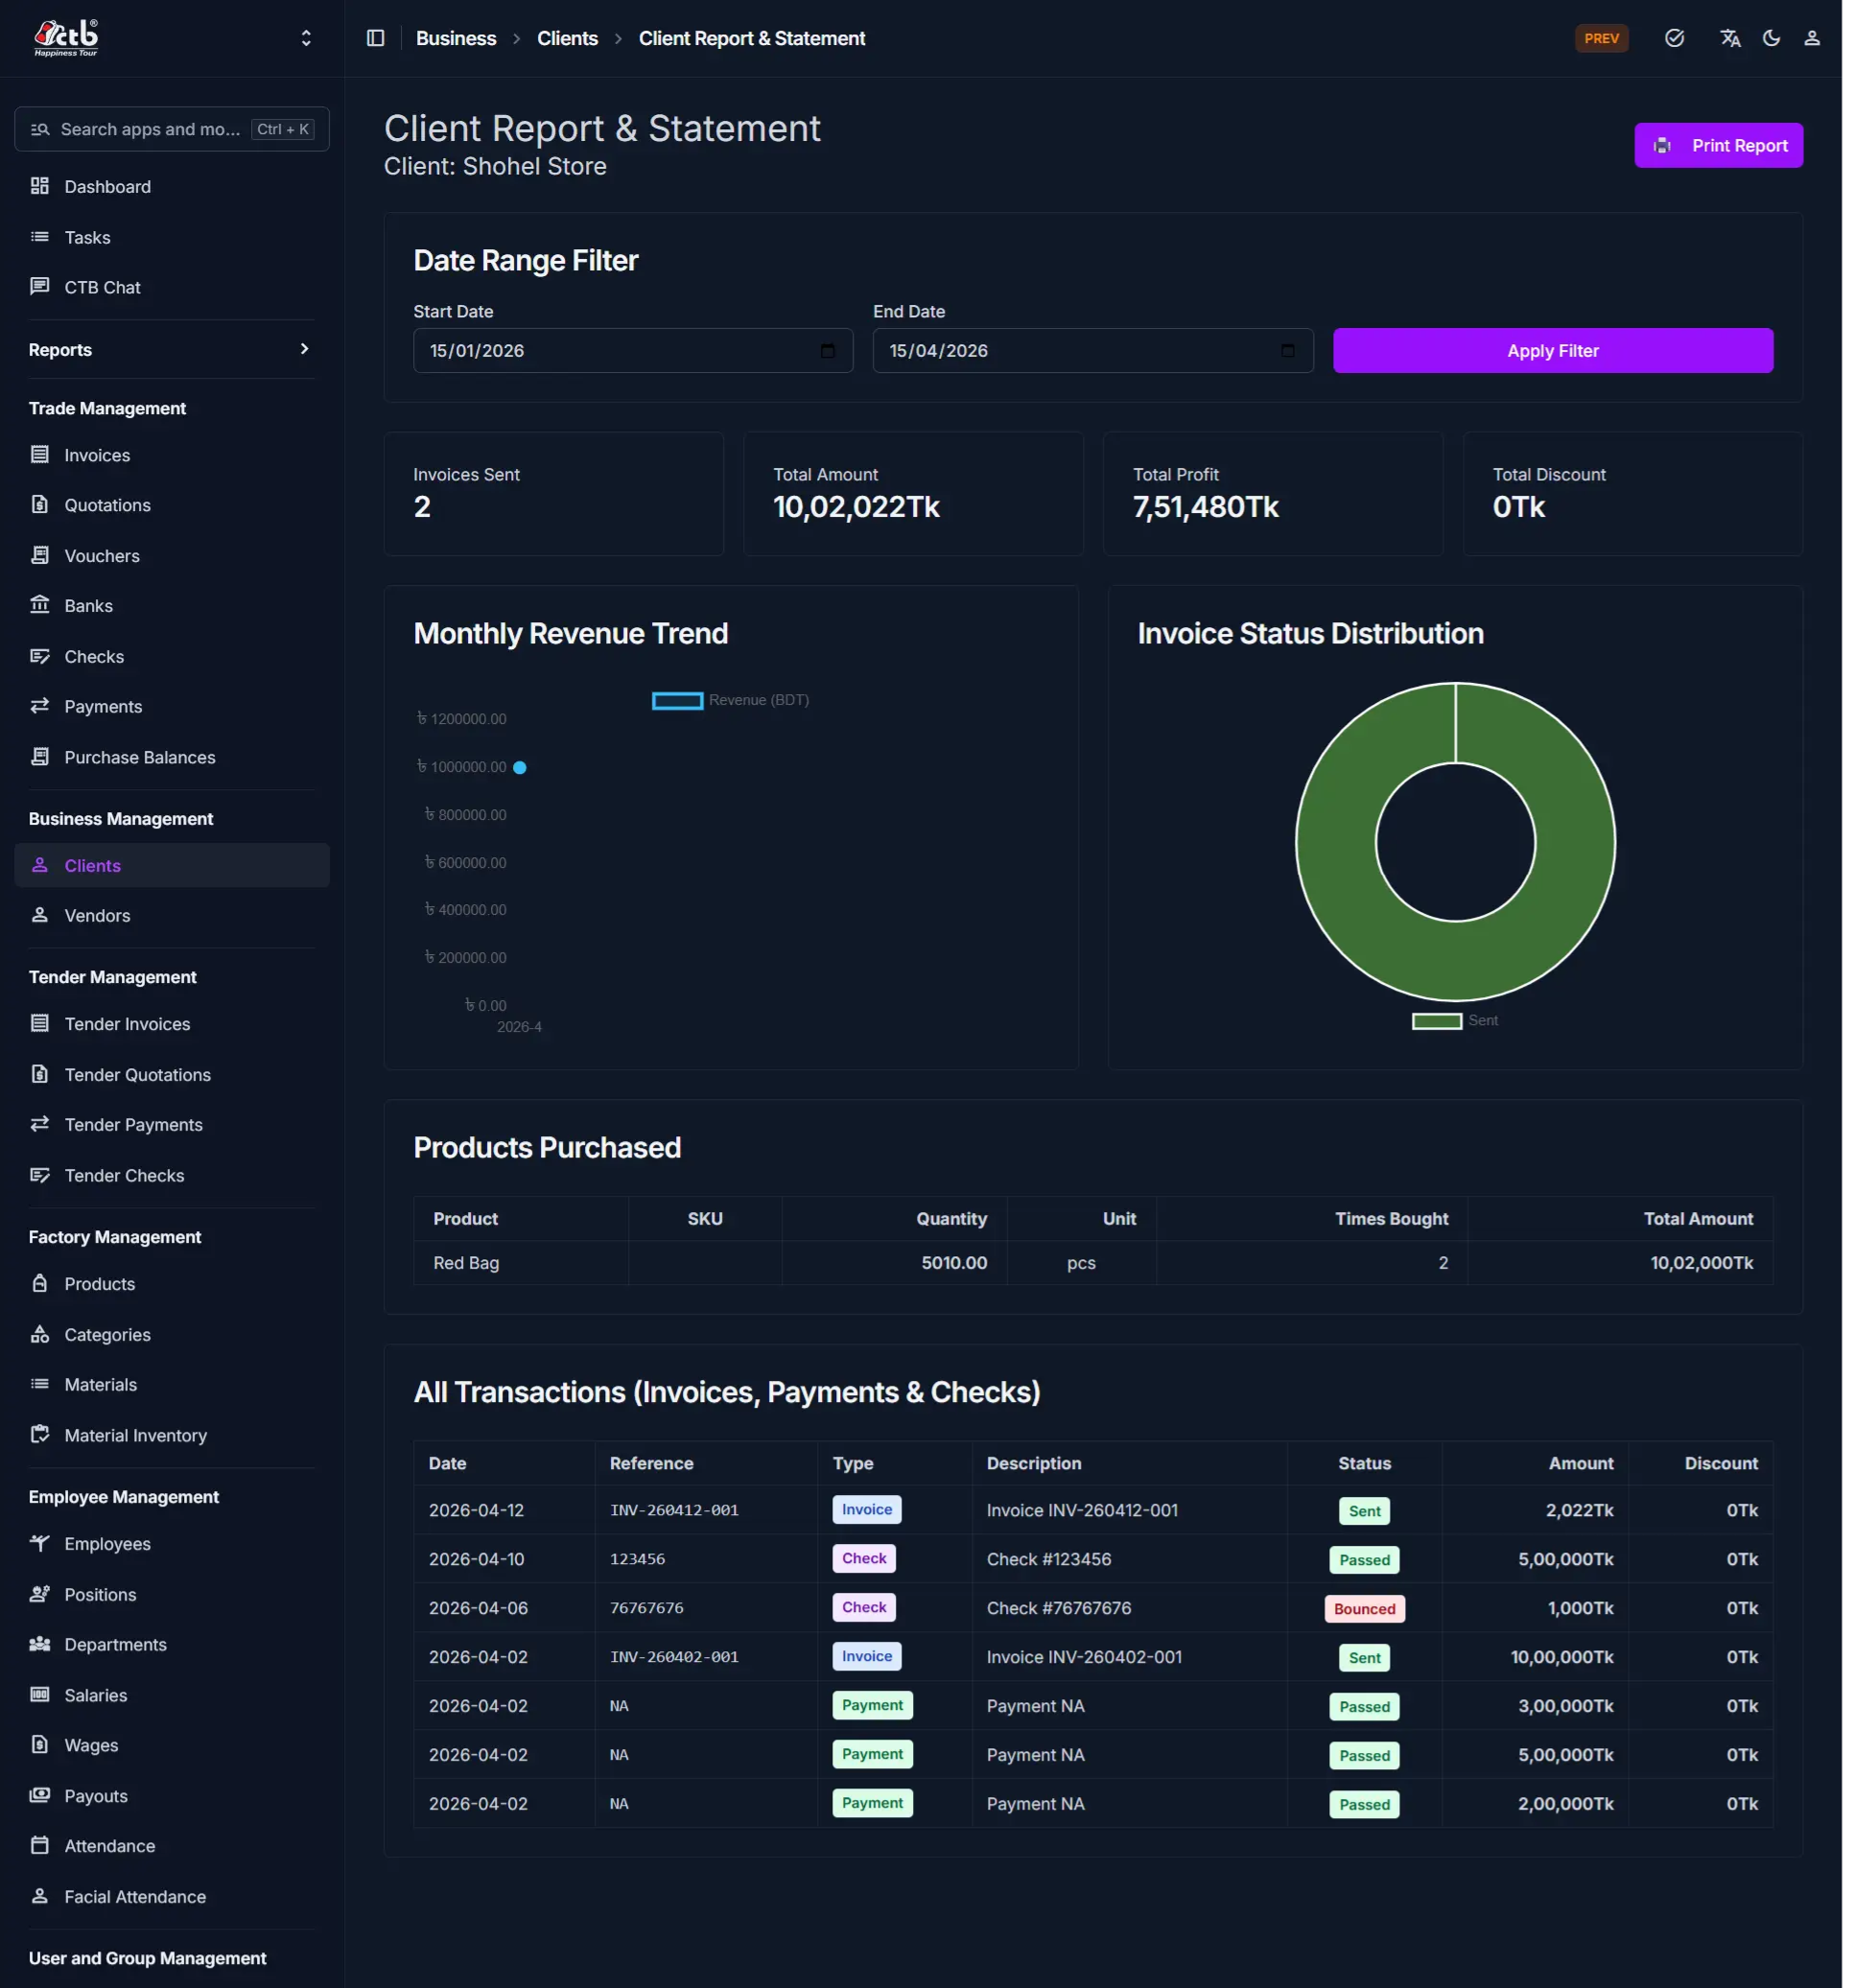
The Client Report page displays:
- Date Range Filter — Filter transactions by start and end date
- Summary Metrics — Key financial totals at a glance
- Revenue Trend Chart — Monthly revenue visualization
- Invoice Status Distribution — Pie chart showing invoice statuses
- Products Purchased — Table of items the client bought
- All Transactions — Complete transaction history (invoices, payments, checks)
Date Range Filter
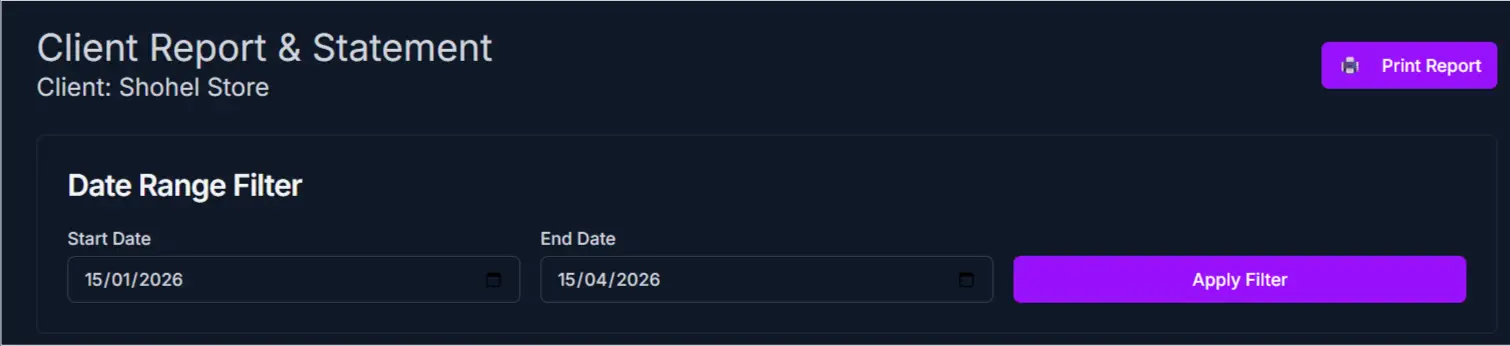
At the top of the report:
- Enter a Start Date in the first field
- Enter an End Date in the second field
- Click the Apply Filter button to refresh the report
The report automatically recalculates all metrics, charts, and tables based on your selected date range.
Summary Metrics Section
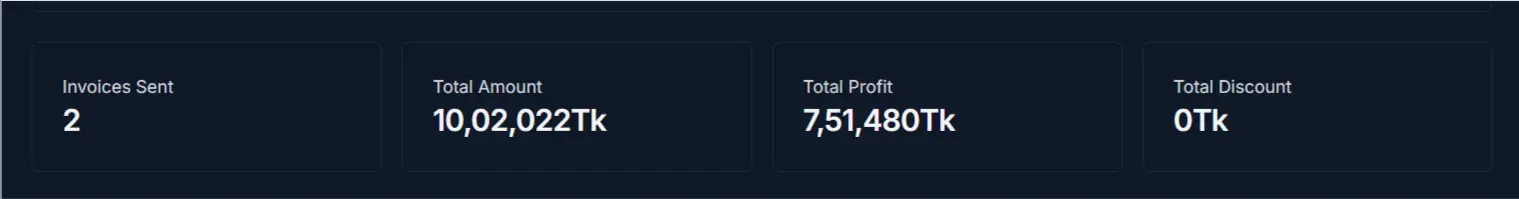
The top section displays key financial information:
| Metric | Description |
|---|---|
| Invoices Sent | Total number of invoices issued to this client |
| Total Amount Sent | Total value of all invoices (in the selected date range) |
| Total Amount | Sum of all transaction amounts |
| Year Discount | Total discounts applied to invoices in the selected period |
Note
All metrics recalculate automatically when you apply a new date range filter.
Charts and Analysis
Monthly Revenue Trend
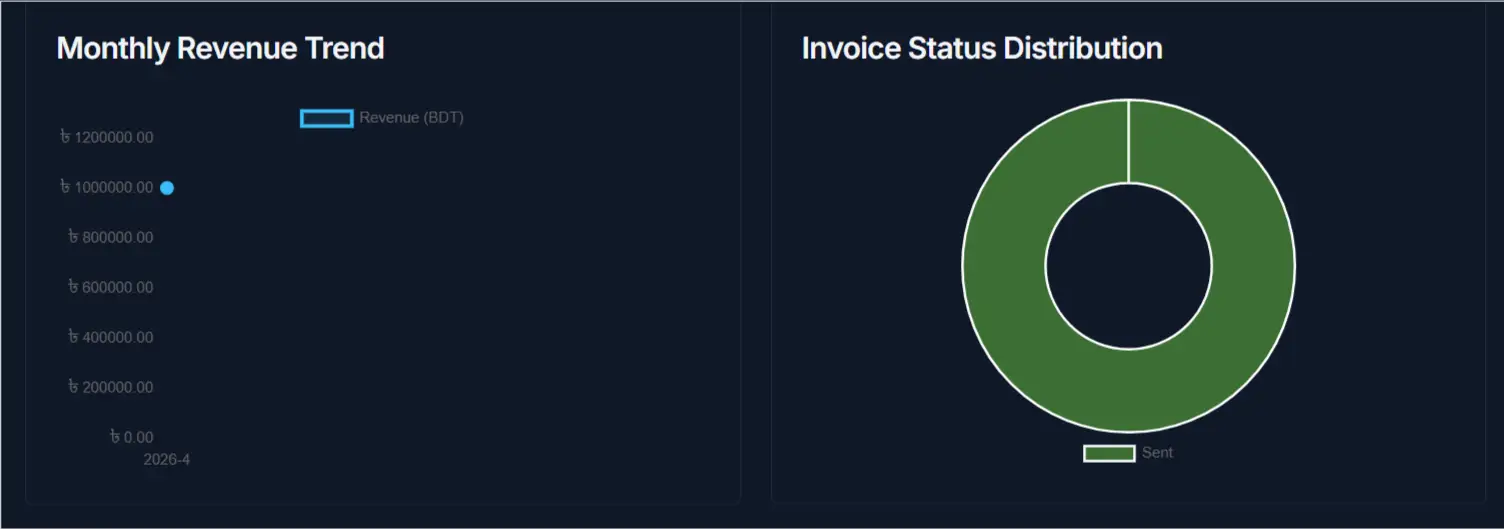
A line chart showing how much revenue (total invoice amount) was generated from this client each month. Use this to identify seasonal patterns or business growth trends.
Invoice Status Distribution
A pie chart displaying the breakdown of invoice statuses (for example: Pending, Paid, Overdue). This helps you quickly assess the client's payment compliance.
Products Purchased
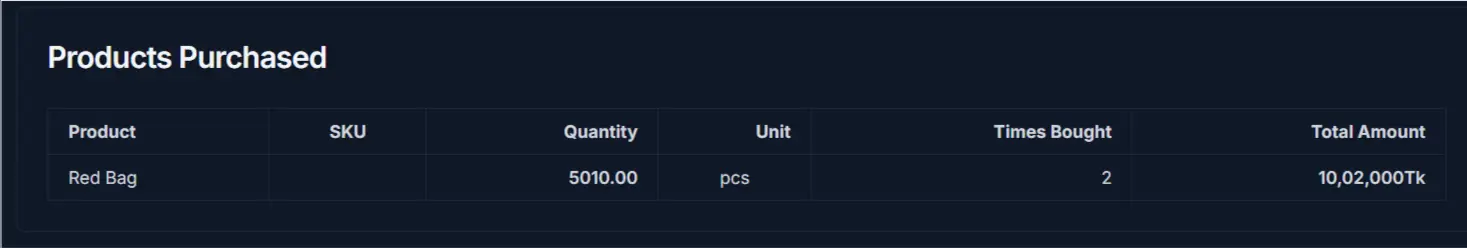
This section lists all products the client has ordered:
| Column | Description |
|---|---|
| Product | Name of the product or item |
| SKU | Unique product ID |
| Quantity | Total units purchased |
| Unit | Measurement unit (pcs, meters, etc.) |
| Times Bought | How many separate transactions |
| Total Amount | Total value of all purchases of that item |
All Transactions
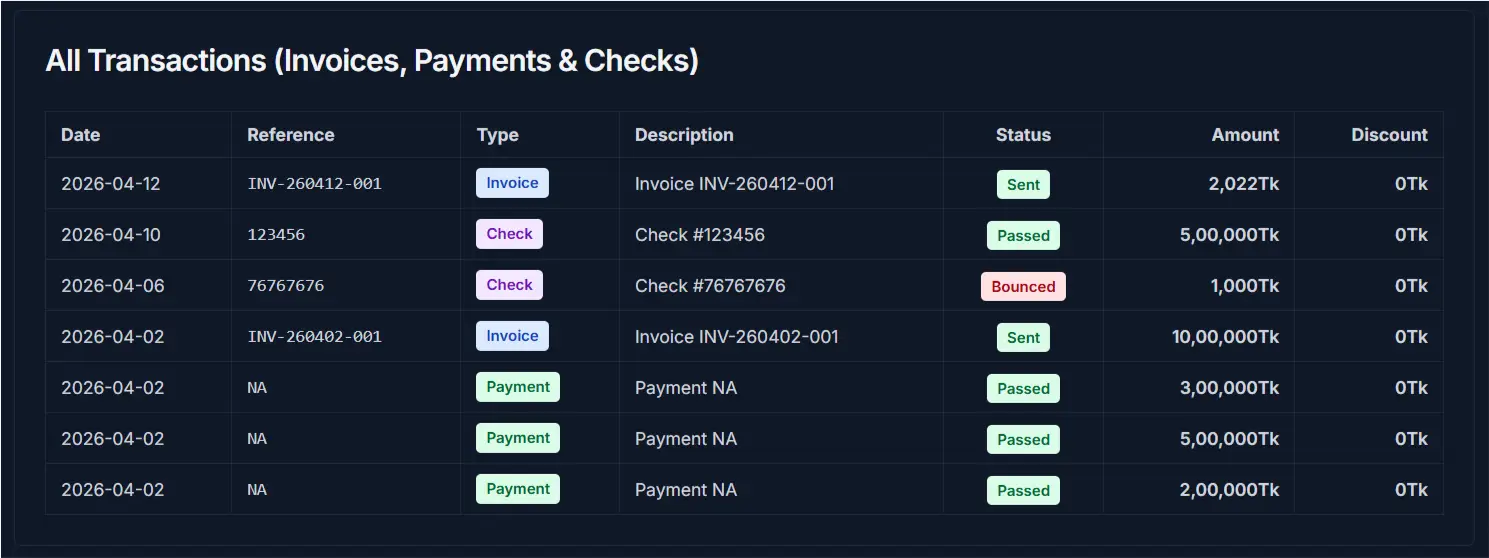
This comprehensive table displays every transaction involving this client (invoices, payments, and checks):
| Column | Description |
|---|---|
| Date | Transaction date |
| Reference | Invoice, check, or payment reference number |
| Type | Transaction type (Invoice, Check, Payment, etc.) |
| Description | Details of the transaction |
| Status | Current status (Paid, Pending, Overdue, etc.) |
| Amount | Transaction amount |
| Discount | Any discount applied |
Note
Transactions are listed in reverse chronological order (most recent first).
Tips and Common Issues
- Use the date range filter to narrow down transactions and focus on specific periods (for example, a quarter or fiscal year)
- The Monthly Revenue Trend chart helps identify payment patterns and seasonal activity
- Invoice Status Distribution quickly shows how many invoices are unpaid or overdue
- Use the Print Report button to generate a formal statement for accounting or customer correspondence
- All monetary amounts display in your system's default currency (typically Thai Baht)
Related Pages
- Client Detail — View and edit client personal and business information
- Client List — Browse all clients and perform bulk actions
- Create Invoice — Issue new invoices to this client
- Invoice Reports — System-wide invoice analytics